ApneaWatch — a sleep lab built from a $30 oximeter.
Every monitor on the market sells you proprietary hardware, locks your data behind a
subscription, and shows it to one phone in Bluetooth range. ApneaWatch inverts all three:
any $30 pulse oximeter from Amazon becomes an overnight monitoring system — vitals
streaming live to any screen on Earth, thresholds calibrated to the sleeper's age, and a
one-page report a clinician can act on.
RoleSolo — product, design & engineering
PlatformAndroid + web — one Flutter codebase
StackFlutter · Kotlin/Ktor · Postgres · Railway
StatusIn production · private repository
What this demonstrates
Product judgment under real constraints. It never pretends a $30 oximeter replaces a sleep study — thresholds come from cited clinical literature, and a feature whose thresholds couldn't be sourced was deleted rather than shipped on vibes.
Full-stack range with AI-native tools. Two proprietary BLE protocols reverse-engineered, a realtime WebSocket pipeline into server-side clinical analytics, and one Flutter codebase shipping to Android and the web — in production for months.
An honest register. The centerpiece story is a data-integrity bug the system caught in itself — silently dropped seconds that were hiding real desaturation events — and the scope limits (single-family deployment, no auth) are stated, not implied away.
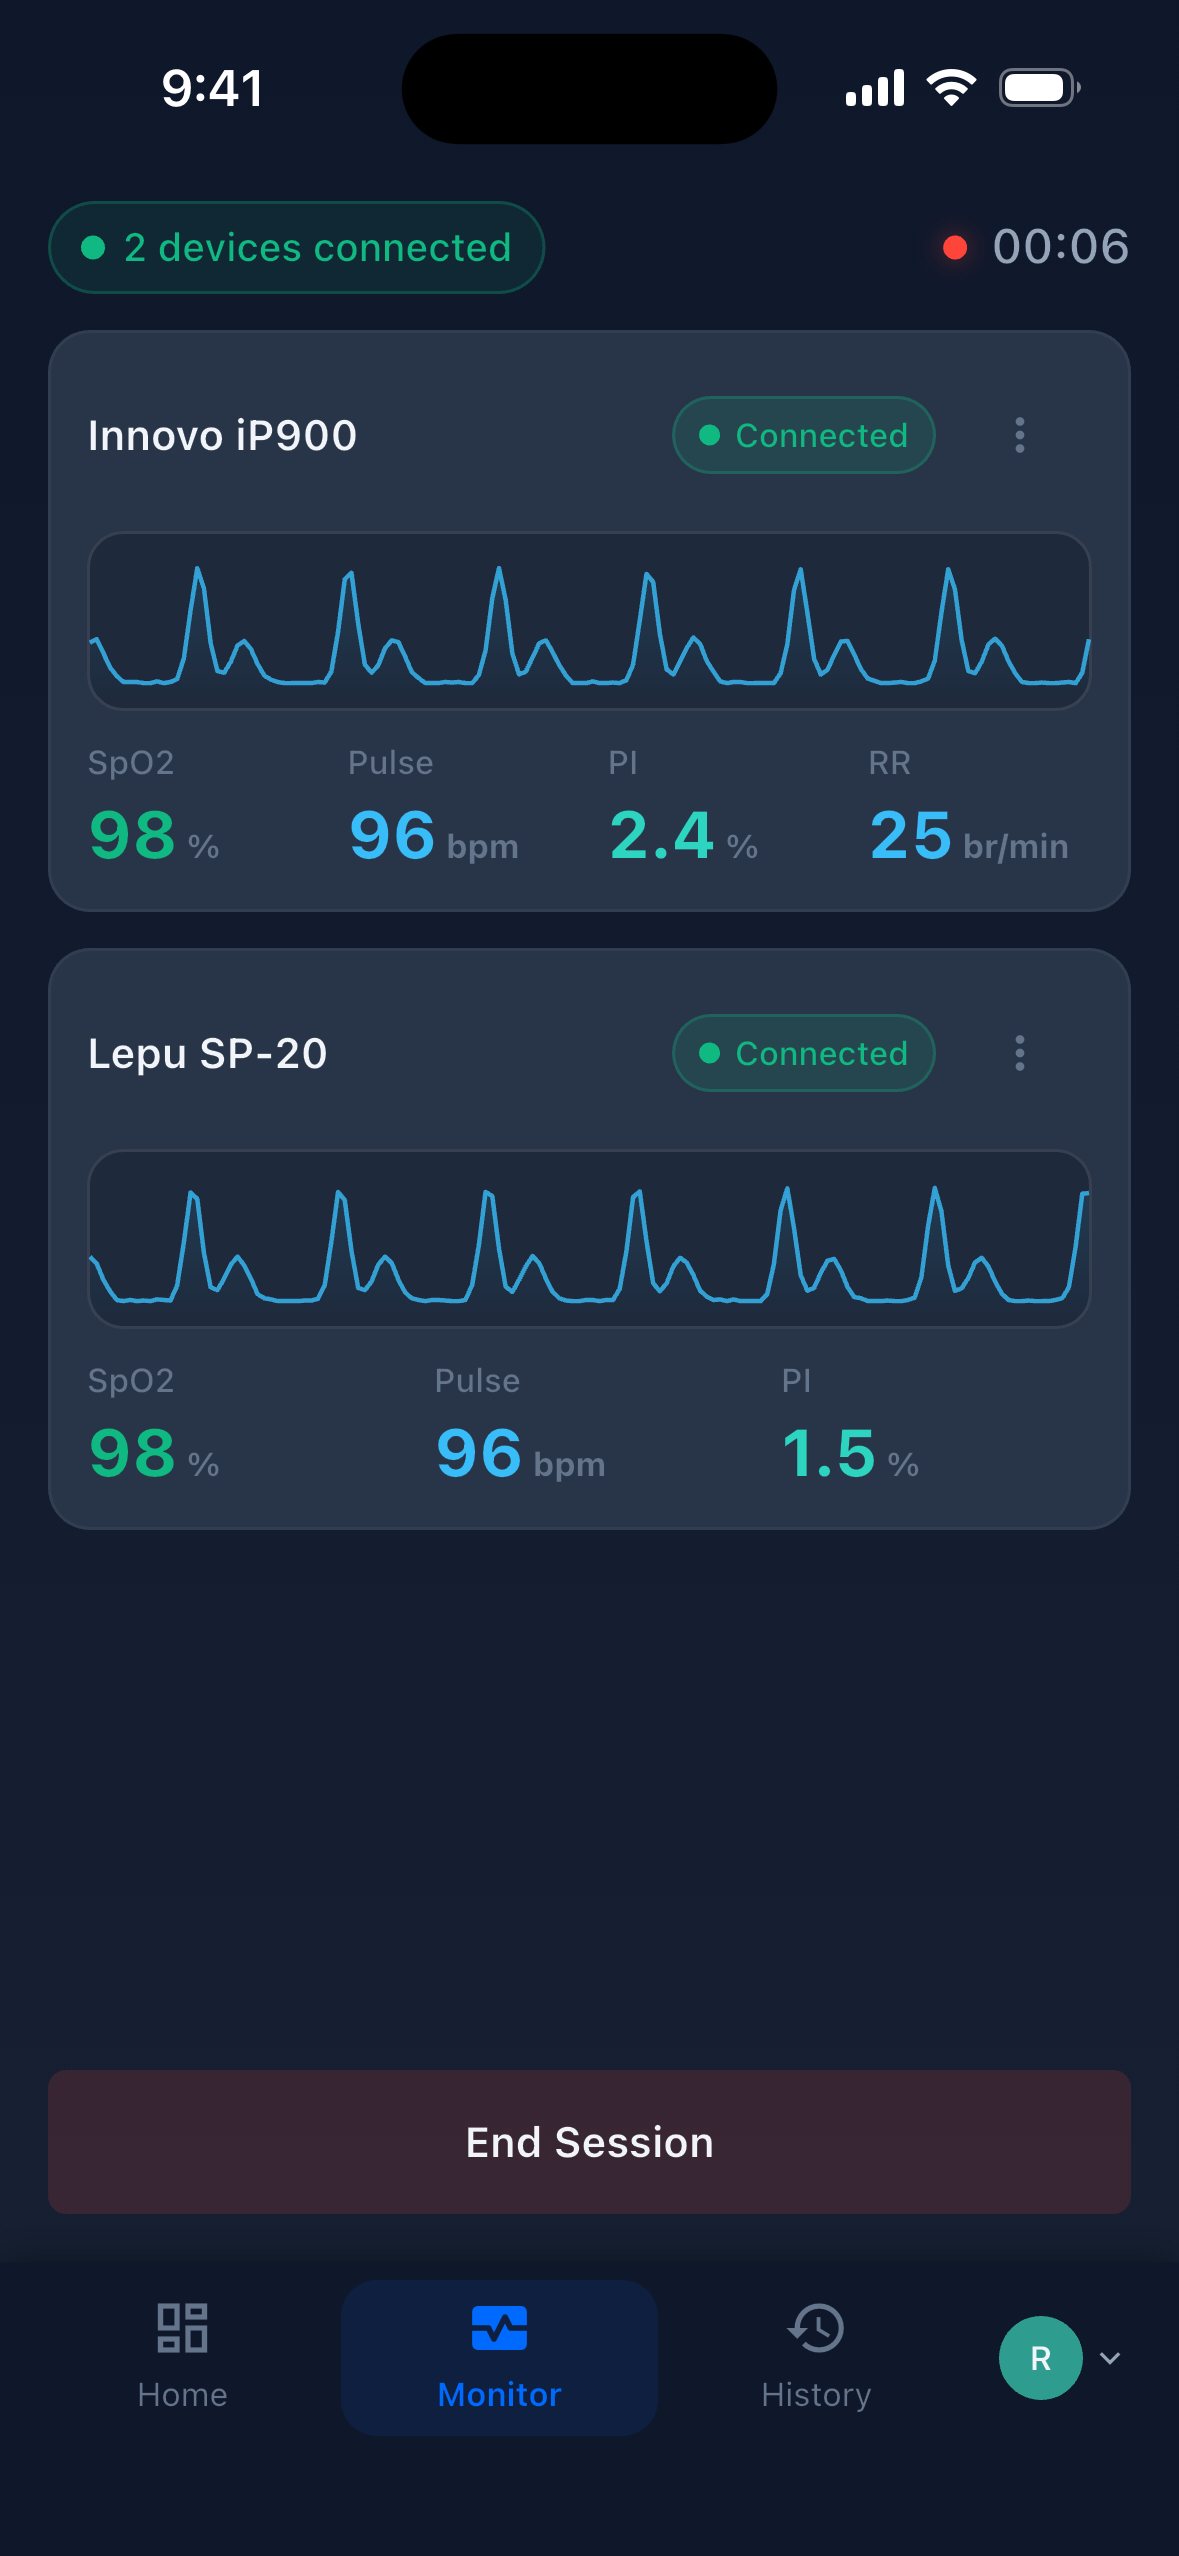
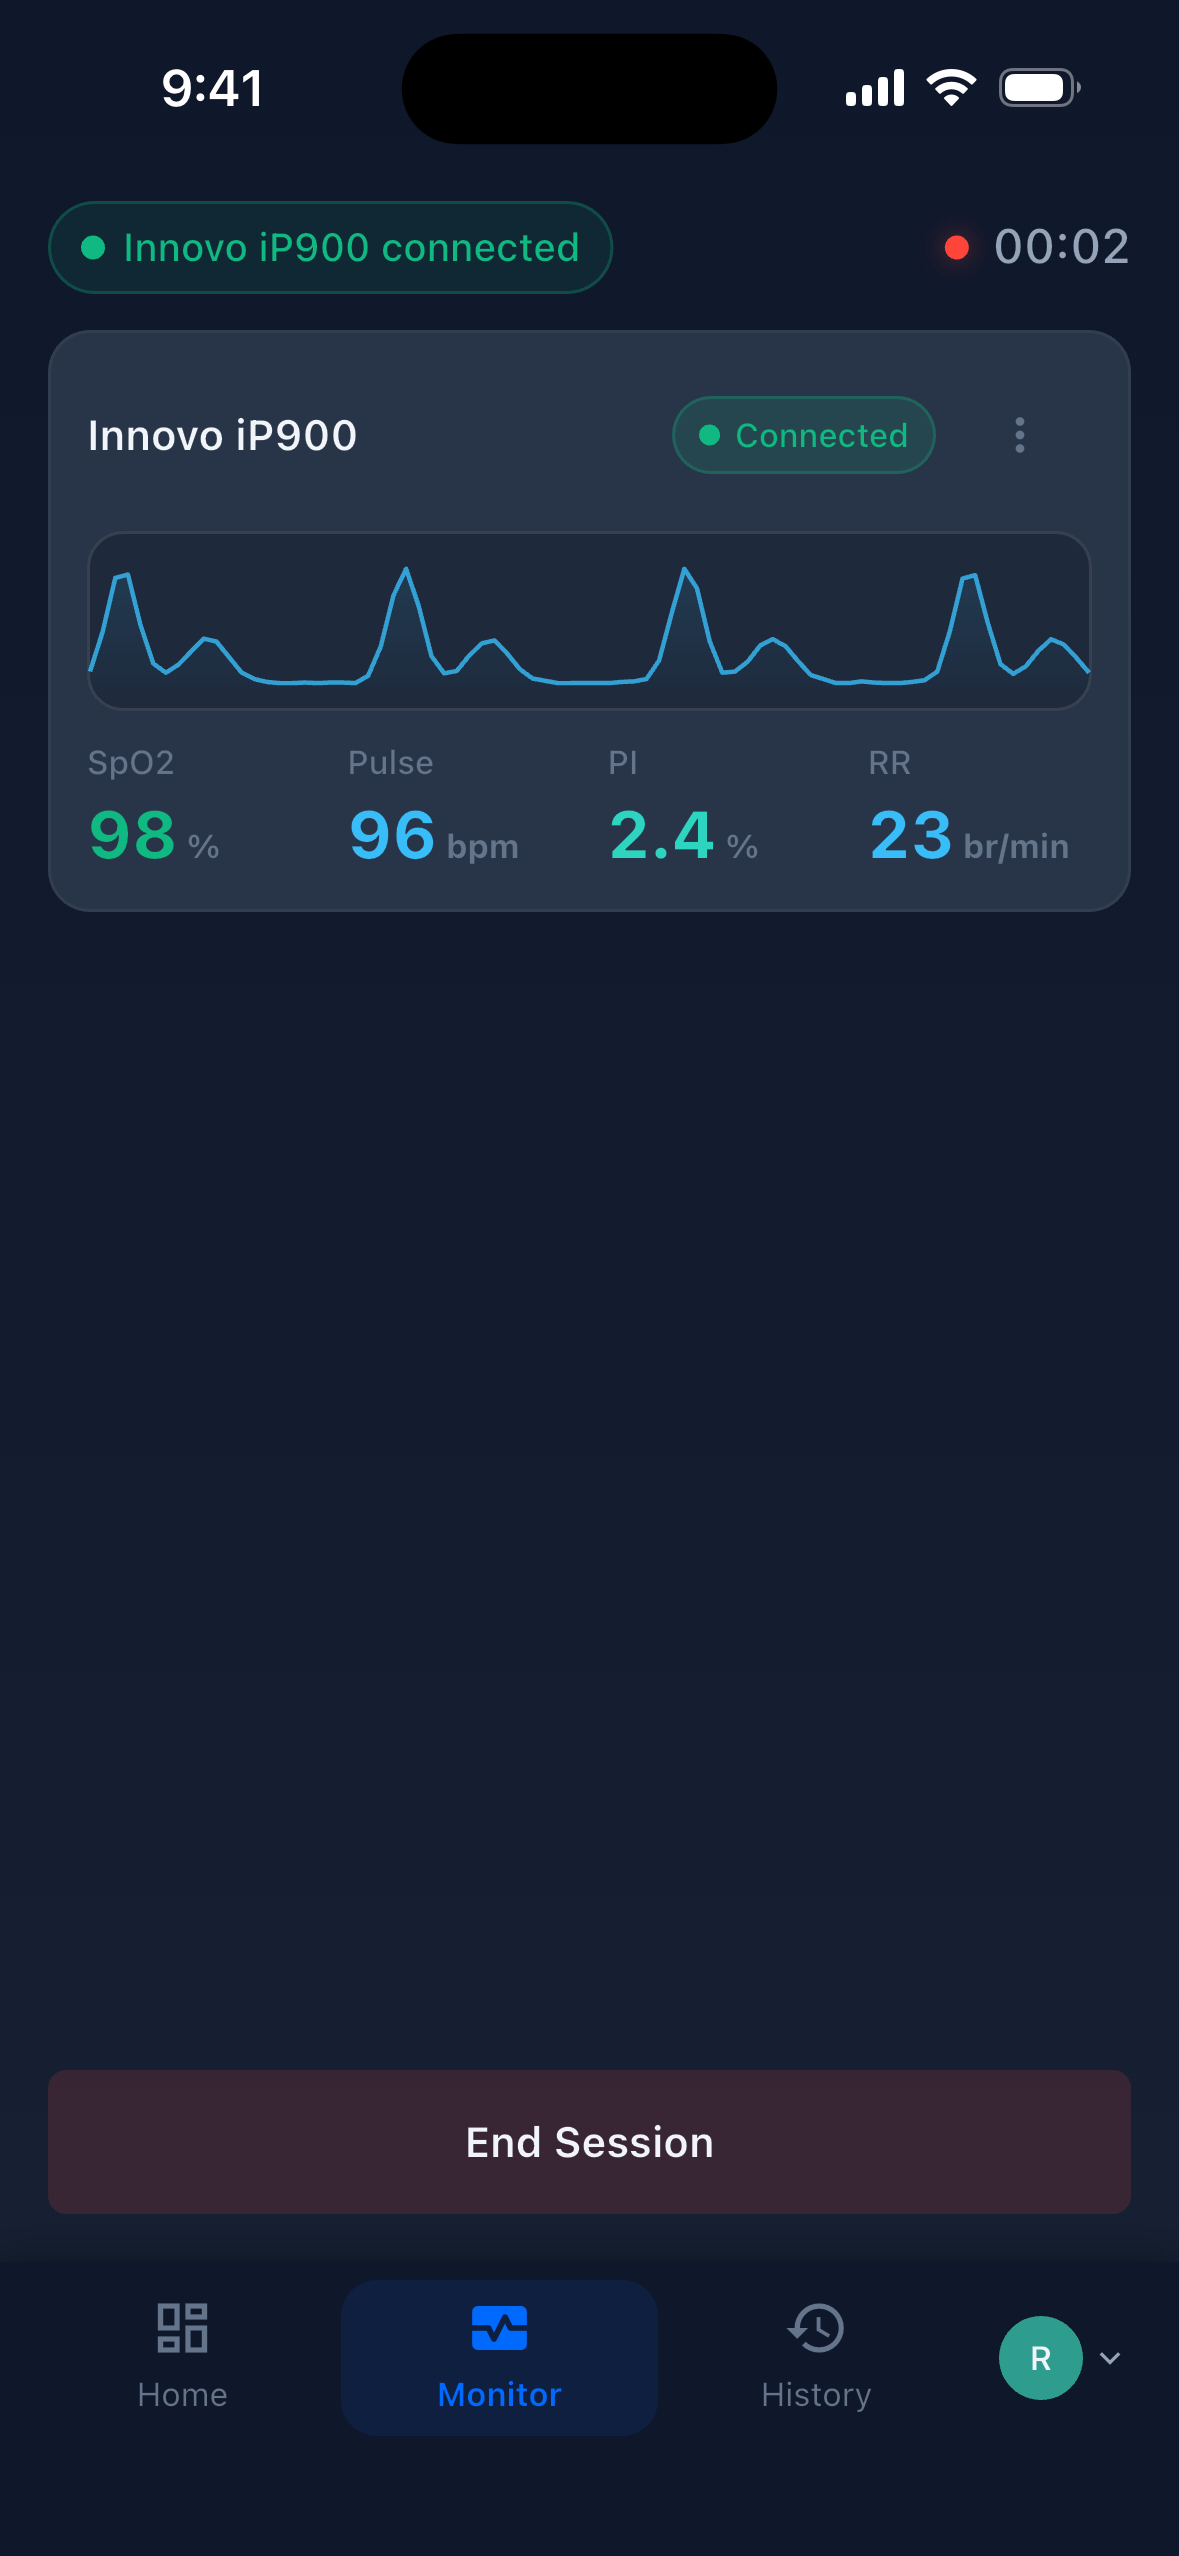
Live monitoring, mid-session — SpO₂, heart rate, and the pulse waveform, streaming. Synthetic demo data.
The problem
Obstructive sleep apnea affects 1–5% of children and is chronically
underdiagnosed (Marcus et al., Pediatrics 2012). The peak years are ages two to
seven — kids too young to tell you they stopped breathing.
The gold standard is an in-lab polysomnogram. It costs $1,000–$7,000,
the wait runs weeks, and for a preschooler it means eleven or twelve hours in a strange
hospital bed wired with EEG electrodes, a nasal cannula, chest belts, and a CO₂
monitor. A toddler who hates hospitals does not sleep normally in one. The test perturbs
the very thing it's trying to measure.
And the at-home alternative doesn't exist. The American Academy of Sleep Medicine
explicitly does not recommend home sleep apnea testing for children —
the portable rigs lack the EEG and CO₂ channels pediatric scoring needs. So parents
are stuck between a hospital ordeal and nothing.
A $30 pulse oximeter cannot replace a sleep study, and this project never pretends it
can. What it can do is answer the question that actually matters at 2 a.m. — is my
child breathing right now? — and arm a clinician with weeks of real nights in the
child's own bed instead of one artificial night in a lab.
Who it's for
Every parent of a snoring, gasping child knows the 2 a.m. version of this: standing over
the crib in the dark, holding your own breath so you can hear theirs, counting the
seconds in a pause that goes on too long. ApneaWatch was built from inside that moment,
for three people at once.
The parents — who need to know, from the kitchen, the office, or the other side of the world, that their child is breathing right now. Not a wellness score in the morning. Right now.
The child — who will never tolerate, and shouldn't have to endure, electrodes and cannulas night after night. A soft clip on a toe is a fair ask. A wired lab bed is not.
The clinician — who doesn't need another wearable's proprietary score. They need weeks of real data, with the methodology and its limits stated up front, on one page they can read in sixty seconds.
It's a bring-your-own-device system on purpose. The oximeter is a commodity; the
protocol work, the clinical calibration, and the pipeline are the product.
Product & journey
One night, end to end
Clip on, tap once — the oximeter goes on a finger or a foot; the phone finds it and vitals are streaming within seconds. Two device families are supported, and both can run at the same time.
Watch from anywhere — live SpO₂, heart rate, and the pulse waveform on any browser or phone, for anyone who needs to see it — not just the one phone in Bluetooth range.
It runs all night — screen off, phone locked, Bluetooth hiccups and all. A foreground service, wake locks, and reconnect loops keep the session alive until morning.
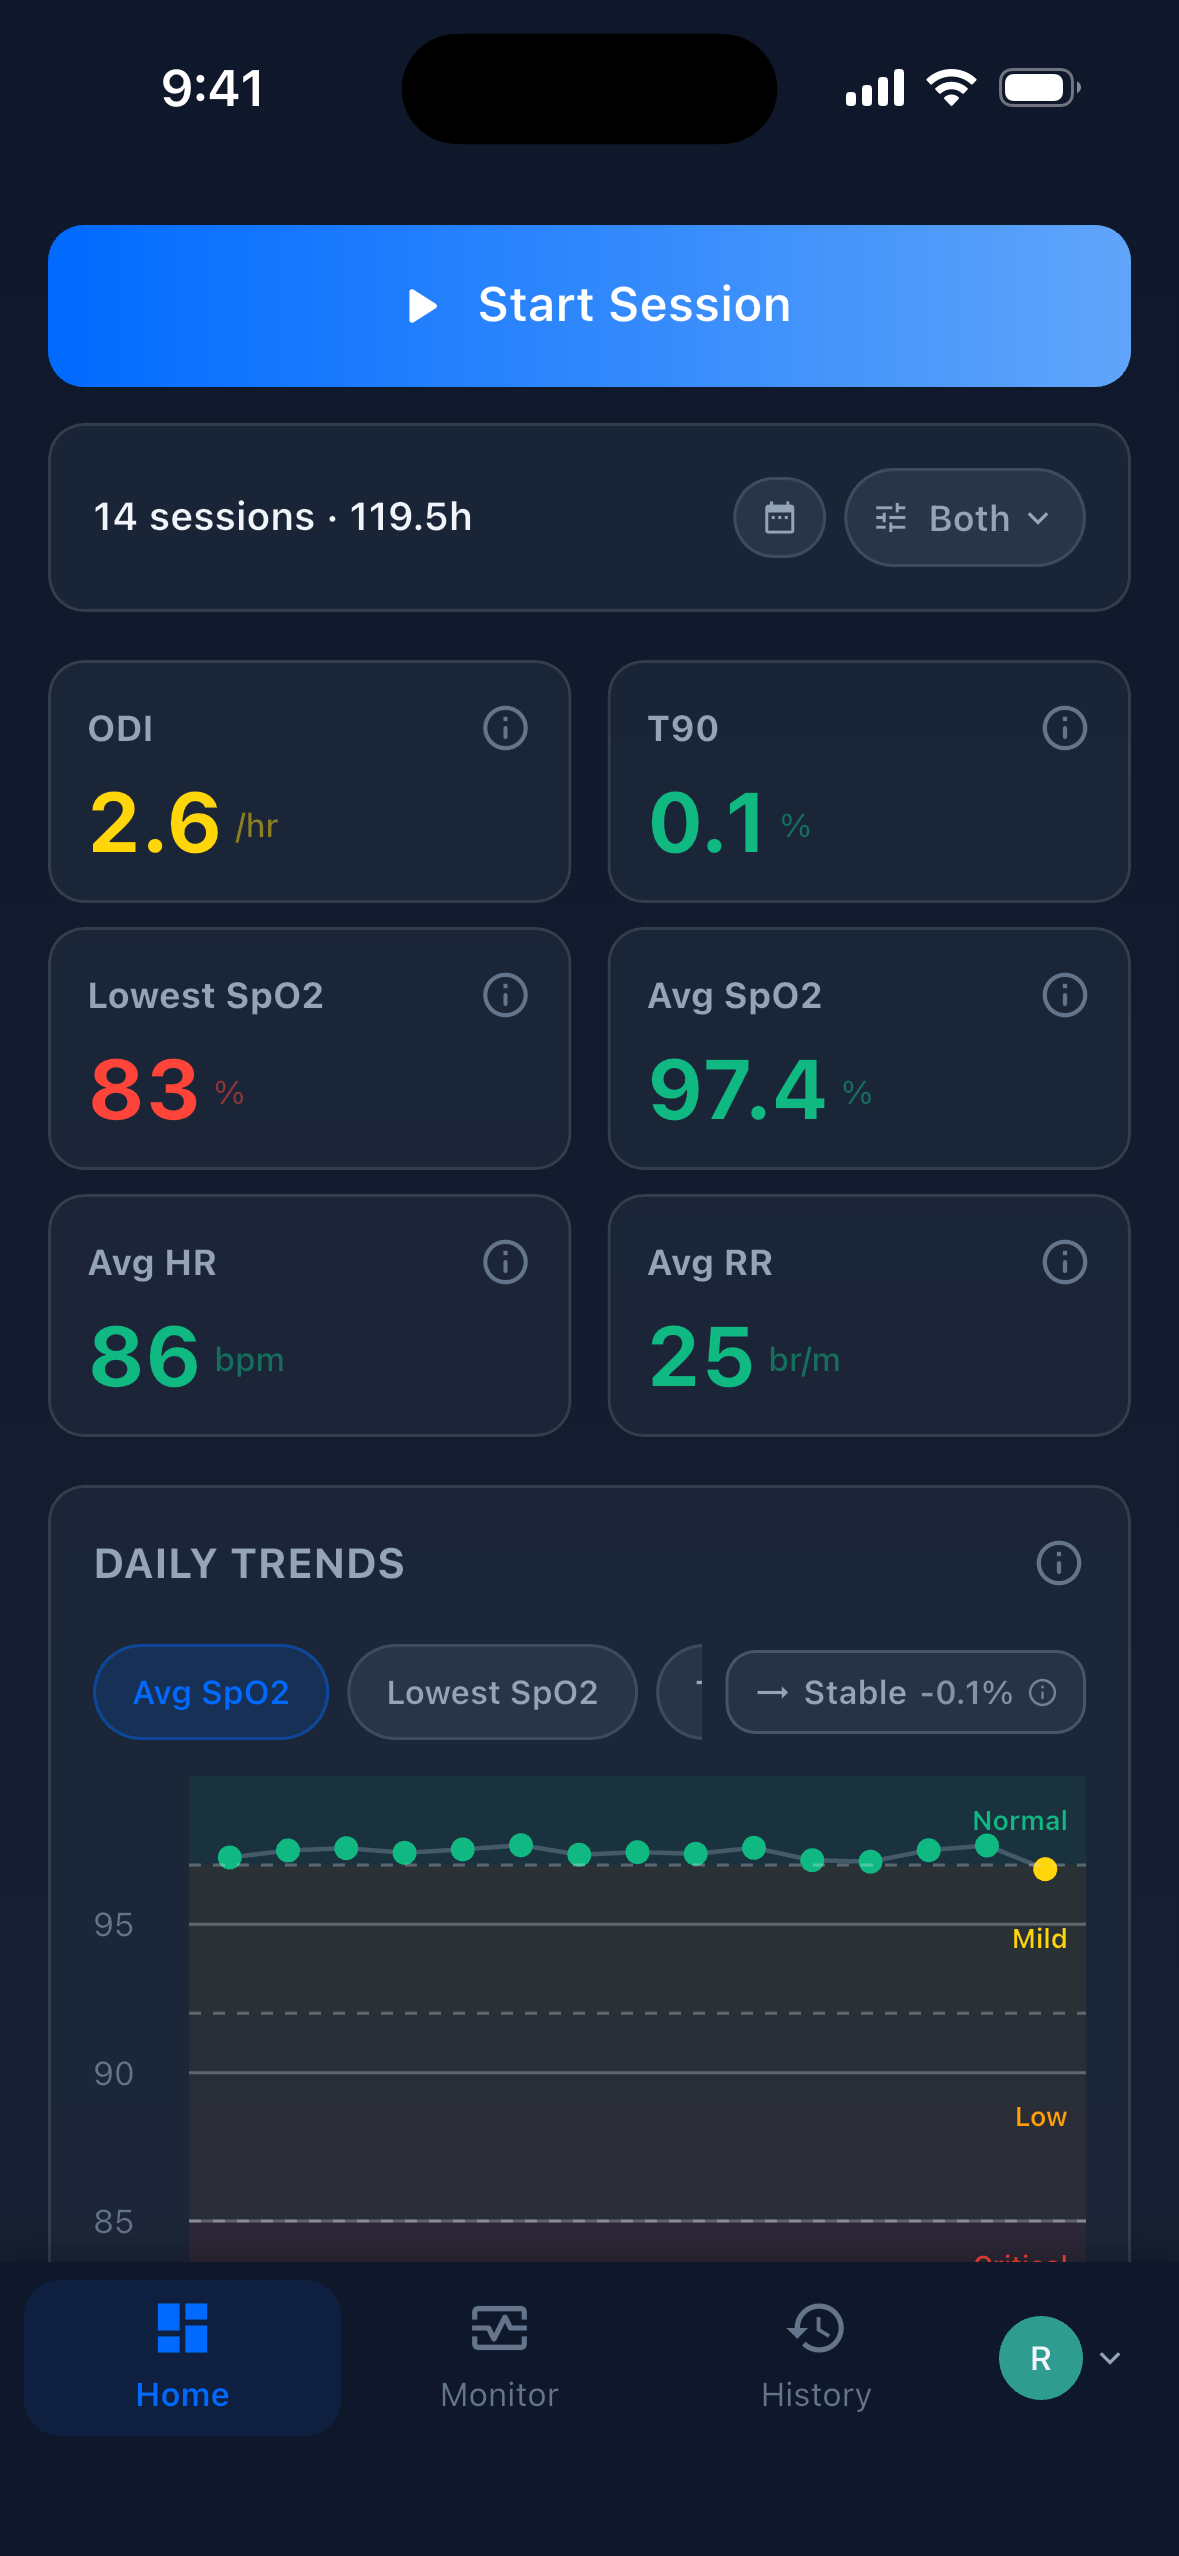
Wake up to answers — the night compressed into desaturation events, time-in-zone charts, and trends, every threshold calibrated to the child's age.
Hand your doctor the night — a one-page summary with the methodology, the definitions, and the limits stated before any number appears.
The morning after — a night compressed into metrics, a calendar, and trends.
Design principles
Five rules run through the codebase. None of them are aspirational — each is visible in
the code, and a couple are visible in what was deliberately deleted.
Every number has a citation. Eighteen in-app tooltips cite their sources — AASM scoring rules, Arch Dis Child, Jung et al. (IEEE TBME 2018), Cleveland Clinic reference ranges. When bradycardia/tachycardia thresholds couldn't be sourced from literature, the feature was deleted rather than shipped on vibes. The commit history shows exactly that.
Age is a first-class input. Six age brackets, derived from date of birth, drive heart-rate ranges, respiratory norms, ODI severity, and SpO₂ zone bands. A number that's normal for a twelve-year-old can be an emergency for an infant.
Honest beats alarming. A probe falling off must never read as a critical event, so a zero-nadir guard rejects artifact readings. "Severe" was renamed "High" in the UI because the app doesn't diagnose. Every report says what the data can and cannot show.
Survive the night. Wall-clock bucketing, streaming frame parsers that resync mid-corruption, 500-message buffers across disconnects, foreground services and wake locks. A monitor that quietly drops data at 3 a.m. is worse than no monitor — it's false comfort.
The device is a commodity; the system is the product. No proprietary hardware, no subscription, no data held hostage. The moat is the reverse-engineered protocols, the clinical calibration, and the pipeline underneath.
Architecture & tech
The hard part of the pipe is the front of it: decoding two proprietary Bluetooth
protocols reliably for eight hours straight. From there the shape is deliberately
boring. One Flutter codebase ships to Android and the web; the phone decodes and
aggregates the BLE stream and pushes it over a WebSocket to a
Kotlin/Ktor API, which batch-inserts raw and per-second data into
PostgreSQL and computes all the clinical analytics server-side. Anyone
watching remotely reads the same API.
PlatformRailway · 2 services · /health checks · restart on-failure · Docker HEALTHCHECK · sessions auto-closed after 2 h abandonment
Two hostile Bluetooth dialects in, one honest clinical record out.
The data tier is sized for the workload, not the résumé: an 8-hour night produces
~1M+ raw rows and 28,800 per-second aggregates per device, so writes
are batched, reads hit composite (session_id, source, time)
indexes, and analytics run on the 1 Hz aggregates rather than the 50 Hz
firehose. Schema changes ship as file-based migrations, and the one time production
data had to be rebuilt, it was done with a dry-run flag and MD5 checksums — more on
that below.
Consumer wellness apps sample occasionally and sync eventually. The bar here was
different: as close to medical-grade as a personal project can honestly get —
continuous ingest, live visibility, and data integrity you can audit. The system is
purpose-built for a single family (mine), and it's been quietly doing its job in
production since April.
~3 months
in production, zero unplanned restarts
84 days
one continuous Postgres deployment
2.1 GB
of vitals data collected
0
error-level logs in the current API deployment (18+ days)
97.6%
API deploy success rate (80/82) · 196 deploys project-wide
~1M+
raw rows ingested per device, per 8-hour night
The current API deployment has run for over eighteen days with zero restarts and zero
error-level logs — the entire log is ten clean startup lines. Liveness is watched the
same way the data is: freshness is computed from actual vitals timestamps, a stale
badge appears at 10 seconds, a disconnected state at 30. The WebSocket retries every
3 seconds and buffers up to 500 messages across a gap; the BLE layer runs its own
reconnect loop with a diagnostic ring buffer; the API auto-closes any session abandoned
for more than two hours. And the honest scope note: there is no paging stack and no
auth — it's a single-family deployment behind obscure URLs, right-sized on purpose, and
I'd rather say so than imply otherwise.
The bug that was hiding disease
The best engineering story in the project is a data-integrity failure. The original
aggregator opened a 1-second window when a frame arrived. One device emits at
roughly 1 Hz with jitter — so windows kept opening a few milliseconds late,
samples fell between them, and the pipeline silently dropped ~27% of wall-clock
seconds. Nothing crashed. Every chart looked plausible. The fix itself was one
line of thinking — bucket on floor(epochMs/1000),
wall-clock time, not arrival time — but the damage was already in production.
So the rebuild was treated like a medical-records migration, not a hotfix. A one-off
SQL procedure re-derived every per-second row from the raw 50 Hz table, ran in
dry-run mode first, wrote a rollback artifact, and verified by MD5 checksum that every
untouched row came out identical. Row count went from 16,440 to 22,313. And the number
that mattered moved: ODI went from 1.71 to 4.23 — the missing seconds
had been hiding real desaturation events. In a medical context, data loss doesn't just
lose data. It hides disease.
The other integrity mechanism is physical: two oximeters at once.
A parent can clip one device to a finger and a second to a foot, and the app runs
both in parallel — separate connections, separate reconnect loops, separate rows in
the database, tagged by source. When a number looks alarming, the second probe site
is a live cross-check: if the finger says 84% and the foot says 97%, you're looking
at a loose clip, not a crisis.
Getting there meant fixing a scan bug where the Bluetooth library's global
scan-stop hid the second device, and building a per-source connection map so each
device fails, reconnects, and buffers independently. The payoff is redundancy that
consumer monitors — locked to one proprietary sensor — structurally can't offer.
Two devices, two probe sites — live cross-validation.
Challenging features
A bring-your-own-device medical monitor has to work with hardware that was never meant
to be opened, show numbers a terrified parent can trust, and stay honest about what a
fingertip sensor can't see. Six problems ate most of the engineering time. For each:
what I tried first, why it broke, where it landed.
1 · Speaking machine code to strangers' hardware
The first attempt was browser-first: Web Bluetooth, no install, open a tab and monitor.
It works — and it's the wrong tool for overnight. The browser demands a re-pair every
session and the connection dies with the tab. So the Android app became the overnight
workhorse (foreground service, wake locks), and the web build was kept for what it's
uniquely good at: being the viewer that runs anywhere. Same Dart interface, two
adapters underneath.
Then the real wall. Consumer oximeters don't speak the standard BLE pulse-oximeter
GATT profile — every vendor ships a proprietary framed protocol, documented nowhere.
The Innovo iP900BP-B masquerades as a Nordic UART serial port and
interleaves 2-byte waveform packets at ~36 Hz with 13-byte vitals packets that I
mapped byte-by-byte: byte 1 is SpO₂, byte 3 heart rate, byte 5 respiratory rate,
byte 11 perfusion index ×10, byte 12 reads 0xF0 while actually measuring.
The Lepu SP-20 was harder: framed packets, a three-step handshake to
unlock the 50 Hz waveform, pulse rate as a little-endian uint16, and a beat-marker
bit packed over 7-bit pleth samples. Its checksum is the war story — no standard CRC-8
variant worked, and the device doesn't error, it just silently ignores you.
The answer was a 256-entry CRC-8 lookup table extracted from the decompiled
vendor AAR. Community reverse-engineering repos exist for these device families
precisely because none of this is written down.
Two proprietary dialects, mapped field by field. Get the CRC wrong and the Lepu silently ignores you.
Bluetooth also doesn't respect your framing: notifications arrive with frames split
across packets and concatenated within them. A streaming parser keeps a rolling buffer,
hunts for the 0xAA 0x55
magic, validates the CRC, and resyncs mid-corruption — so one mangled packet costs one
frame, not the night.
Browser-first was the experiment; mobile-primary with a web viewer is what survived contact with a real night.
2 · What do you show a terrified parent at 3 a.m.?
Getting the numbers wrong has two failure modes, and both are unforgivable: panic a
parent over normal variation, or reassure them through a real event. The defense is
that no threshold in the app is invented.
A parent watching the live screen sees their child's numbers judged against
their child's normal — not an adult's. From date of birth, the app resolves
one of six age brackets, and that bracket drives everything: heart-rate ranges,
respiratory norms, ODI severity bands, and the SpO₂ zone chart. A sleeping
heart rate of 65 is fine for a nine-year-old and alarming for a newborn; an ODI of 6
is borderline for an adult and clearly abnormal for a toddler. The same drop reads
differently at different ages, and it should.
Every one of those judgments traces to a published source — PALS-derived heart-rate
ranges, pediatric ODI cut-offs from Arch Dis Child, AASM adult bands — and
the app shows its work: tap any threshold and a tooltip cites the study it came
from, in plain language. Eighteen of those tooltips exist. The client and server
keep the zone definitions deliberately in lockstep, so the number a parent sees at
3 a.m. is the same number the analytics engine scored the night with.
Just as telling is what got removed: bradycardia/tachycardia event detection
shipped briefly on heuristic thresholds, couldn't be sourced, and was deprecated —
the functions now return empty, with the reasoning left in code comments.
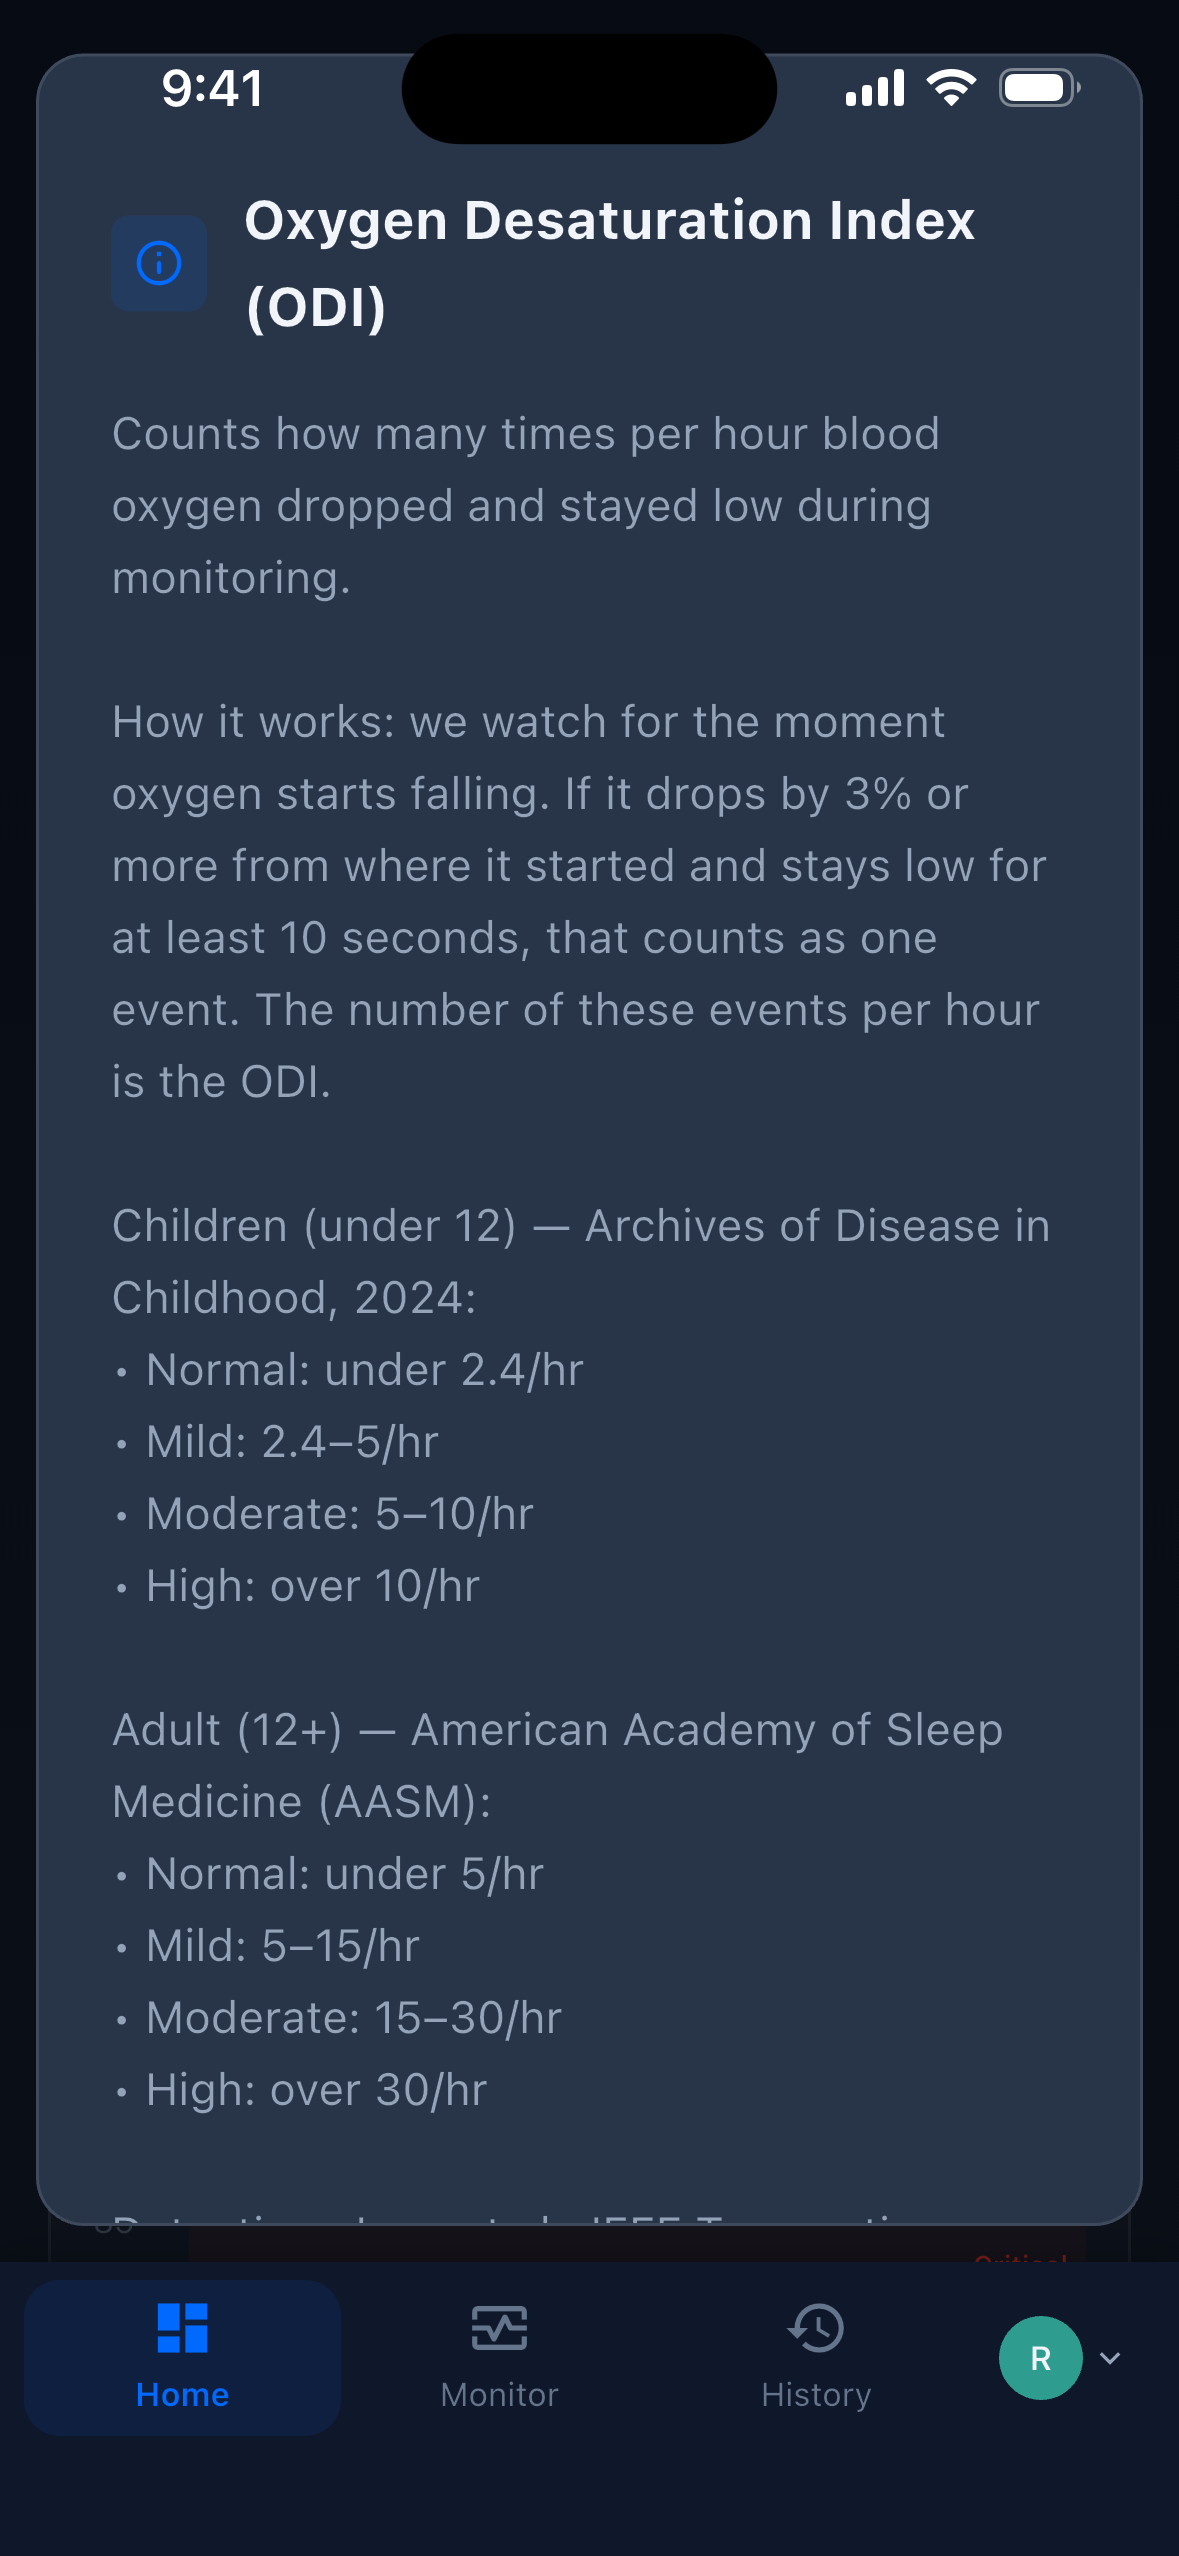
Tap any threshold — see the study behind it.
The adult row is the point: an adult "mild" ODI would already be moderate-to-severe territory for a child.
Underneath the zones sits the event detector itself — a faithful implementation of
Jung et al. (IEEE TBME 2018). Onset is a drop of ≥1% sample-to-sample;
it becomes an event if the drop reaches 3% (ODI3) or 4% (ODI4) and lasts at least
10 seconds; recovery is a return to within 1% of baseline, capped at 90 seconds.
Readings at or below 25% are rejected as artifact, events are computed on float
1 Hz means (integer rounding was causing false triggers), and a zero-nadir guard
makes sure a probe falling off never scores as a critical desaturation.
The event anatomy behind ODI — the same explainer, hand-drawn, went to the ENT with the report.
3 · Both parents, one heartbeat
The scenario this was built for: one parent doing dishes downstairs, the other on a
work trip nine time zones away — both watching the same live vitals at the same time.
No consumer monitor does this; the device's own companion app only works within
Bluetooth range of the sensor.
The monitoring phone and a remote browser, side by side — the same heartbeat on both screens within a second. Synthetic demo data.
The plumbing is deliberately simple, and I'll describe it exactly as built. The
monitoring phone streams batched vitals over a WebSocket to the API, which
batch-inserts them into Postgres. Every remote viewer's dashboard polls the active
session once per second over REST and renders the latest vitals — in practice, a
remote screen is under a second behind the sensor. A server-side WebSocket fan-out
channel exists, but the shipped clients don't consume it; 1-second polling was simpler,
debuggable, and fast enough, so that's what runs. Honesty lives in the UI too:
freshness is computed from the vitals timestamps themselves, and the live banner
degrades visibly — stale at 10 seconds, disconnected at 30 — rather than showing a
confident number from a dead stream.
WS in, 1 s polling out — described exactly as built, with the unused fan-out drawn in dashed honesty.
4 · Compressing a night into a glance
A parent opens the app over coffee and gets the whole night in one screen: six
color-coded summary metrics, a calendar heatmap where each day wears its status, and
trend lines with direction badges showing whether the last two weeks are getting
better or worse. It took 40+ iteration commits to make that screen
trustworthy, because almost every hard problem was about honesty, not layout.
What counts as "a day" when a night straddles midnight? (Every reading is grouped
into Pacific calendar days with DST-safe math, so a 10 p.m.–6 a.m. session doesn't
split into two misleading half-nights.) What about a 15-minute nap with the probe
half-on? (Nights under 20 valid minutes are excluded from the trend signal.) What
should a chart do at a disconnect? (Lines now break at gaps instead of interpolating
across them — a flat line you didn't measure is a lie.) Even the chart library
fought back: Bézier smoothing was overshooting below real minima, painting fake
desaturations, until the curves were tamed.
Performance got one structural fix: the dashboard originally loaded per-session
data in N+1 queries, and now one bulk query feeds the entire view.
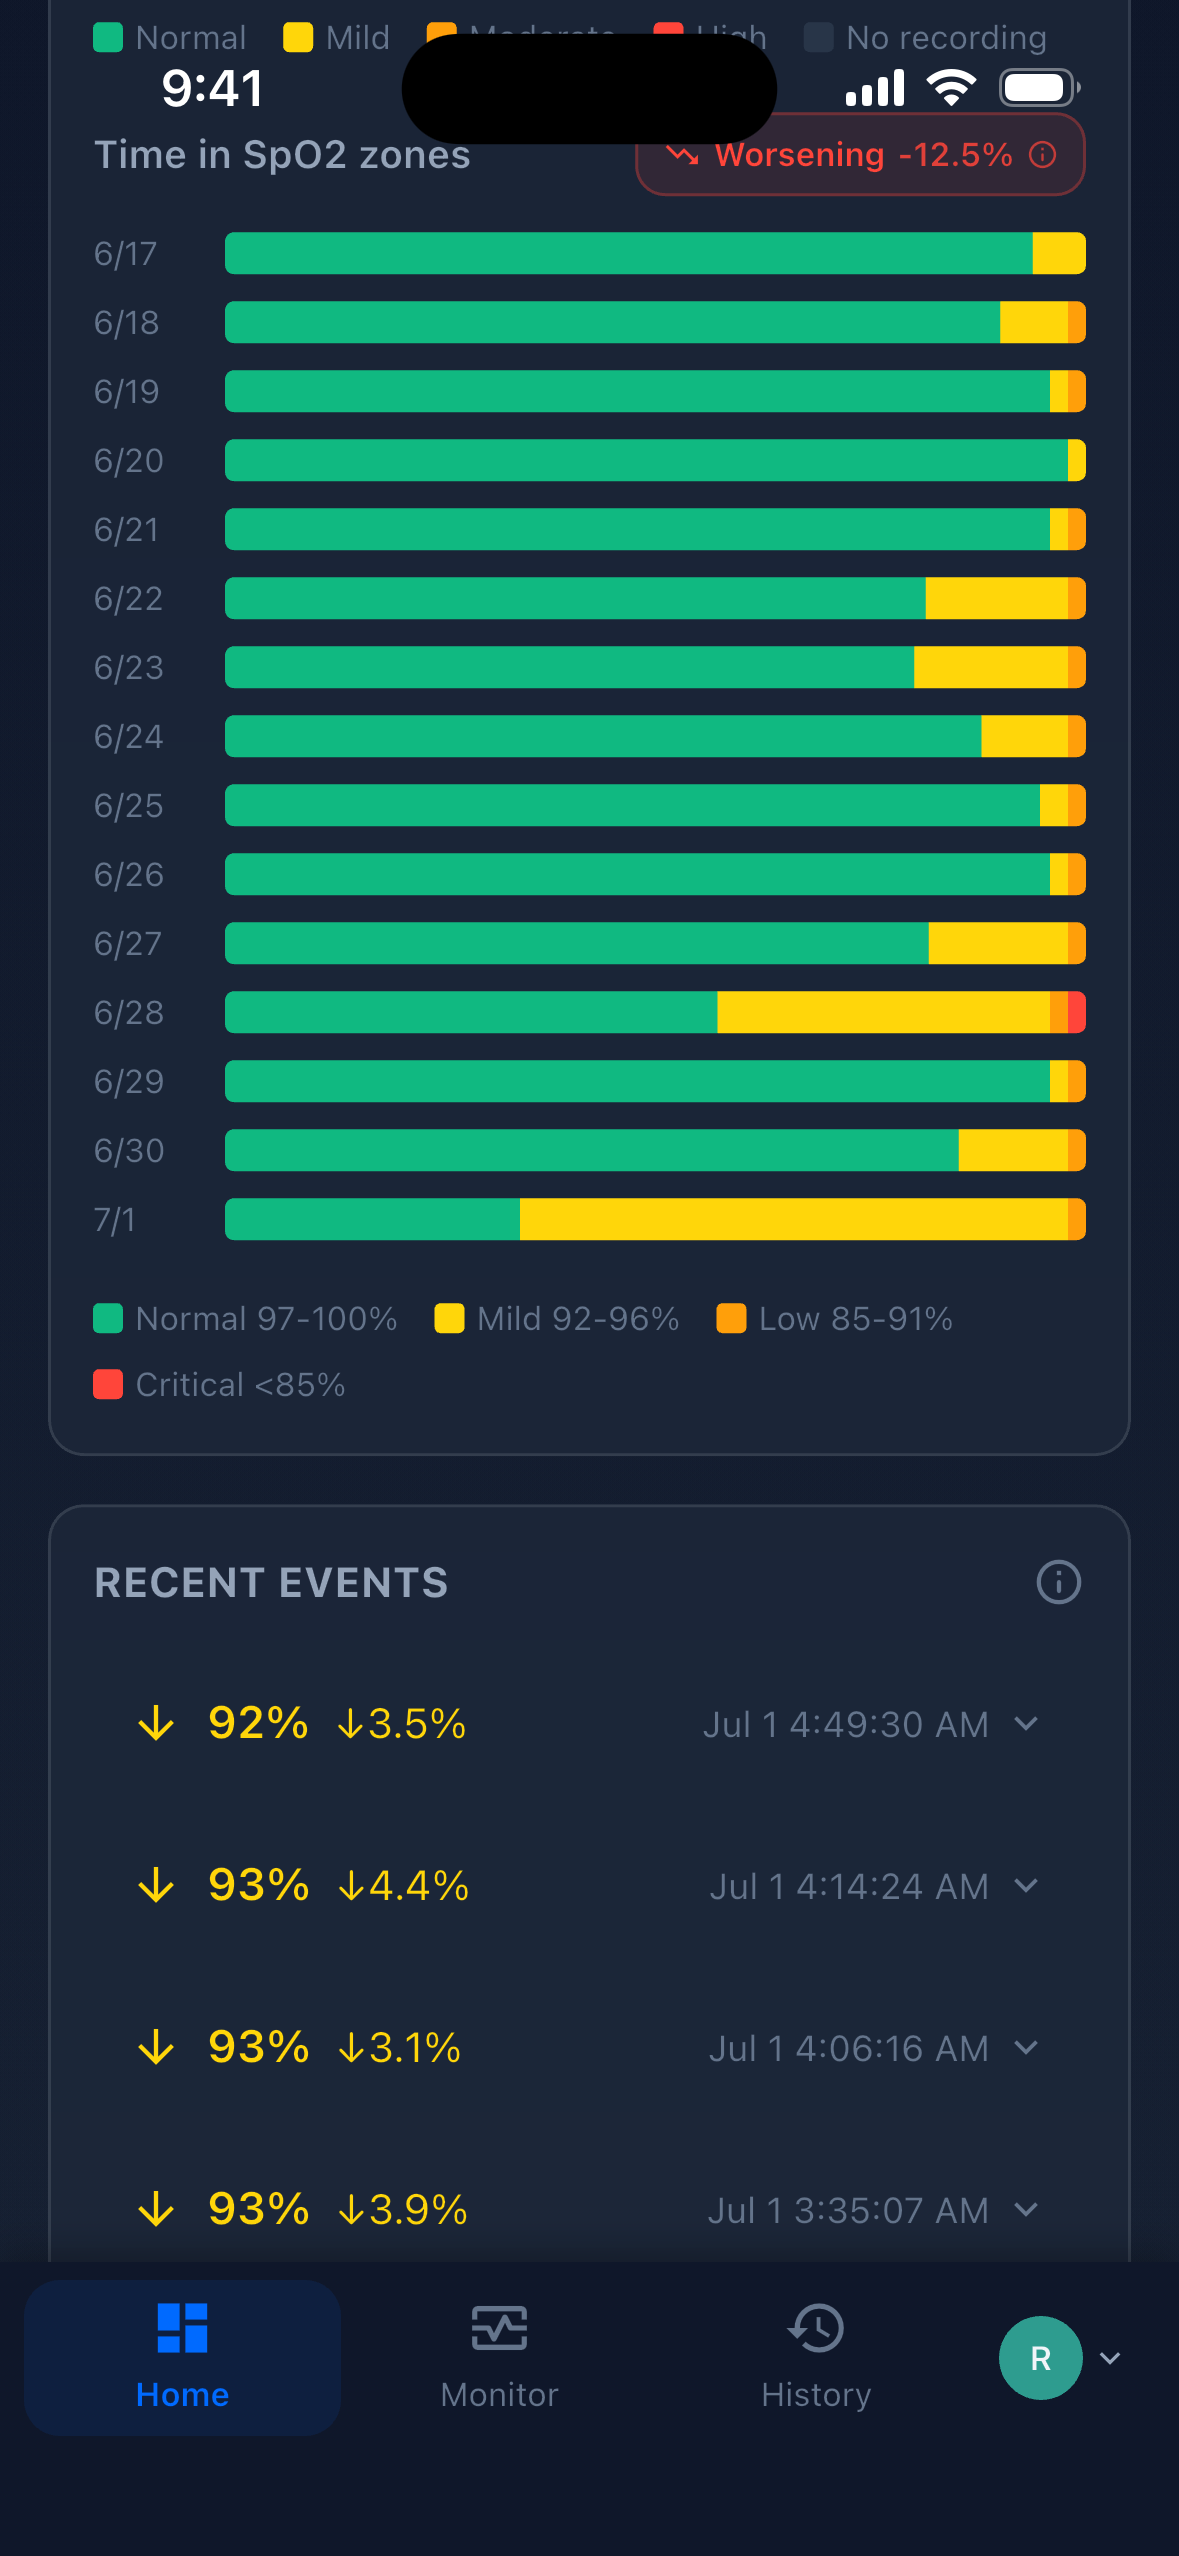
The morning screen — metrics, calendar, trends, all age-calibrated.
Raw firehose → wall-clock seconds → day trends → one glanceable screen. The dashed box is the bug that started the audit.
The same discipline carries into replaying a single night. The session view offers
tabbed SpO₂, heart-rate, respiratory-rate, and perfusion timelines you can
scrub through, with every detected event listed as an expandable row underneath —
tap one and you're looking at the exact minutes it happened. Where the connection
dropped, the chart line simply stops and restarts; the gap is the information.
Parents can also attach context to a session — sleeping position, illness, snoring
— notes that later surface in the clinician report, because "she had a cold that
week" is exactly the kind of thing a doctor asks about.
One more discipline note from the commit history: a motion-artifact flagging system
and a clinician export were built, judged not right yet, and reverted in a single
commit. Shipping half-trustworthy features to a parent's sickbed dashboard is how
trust dies.
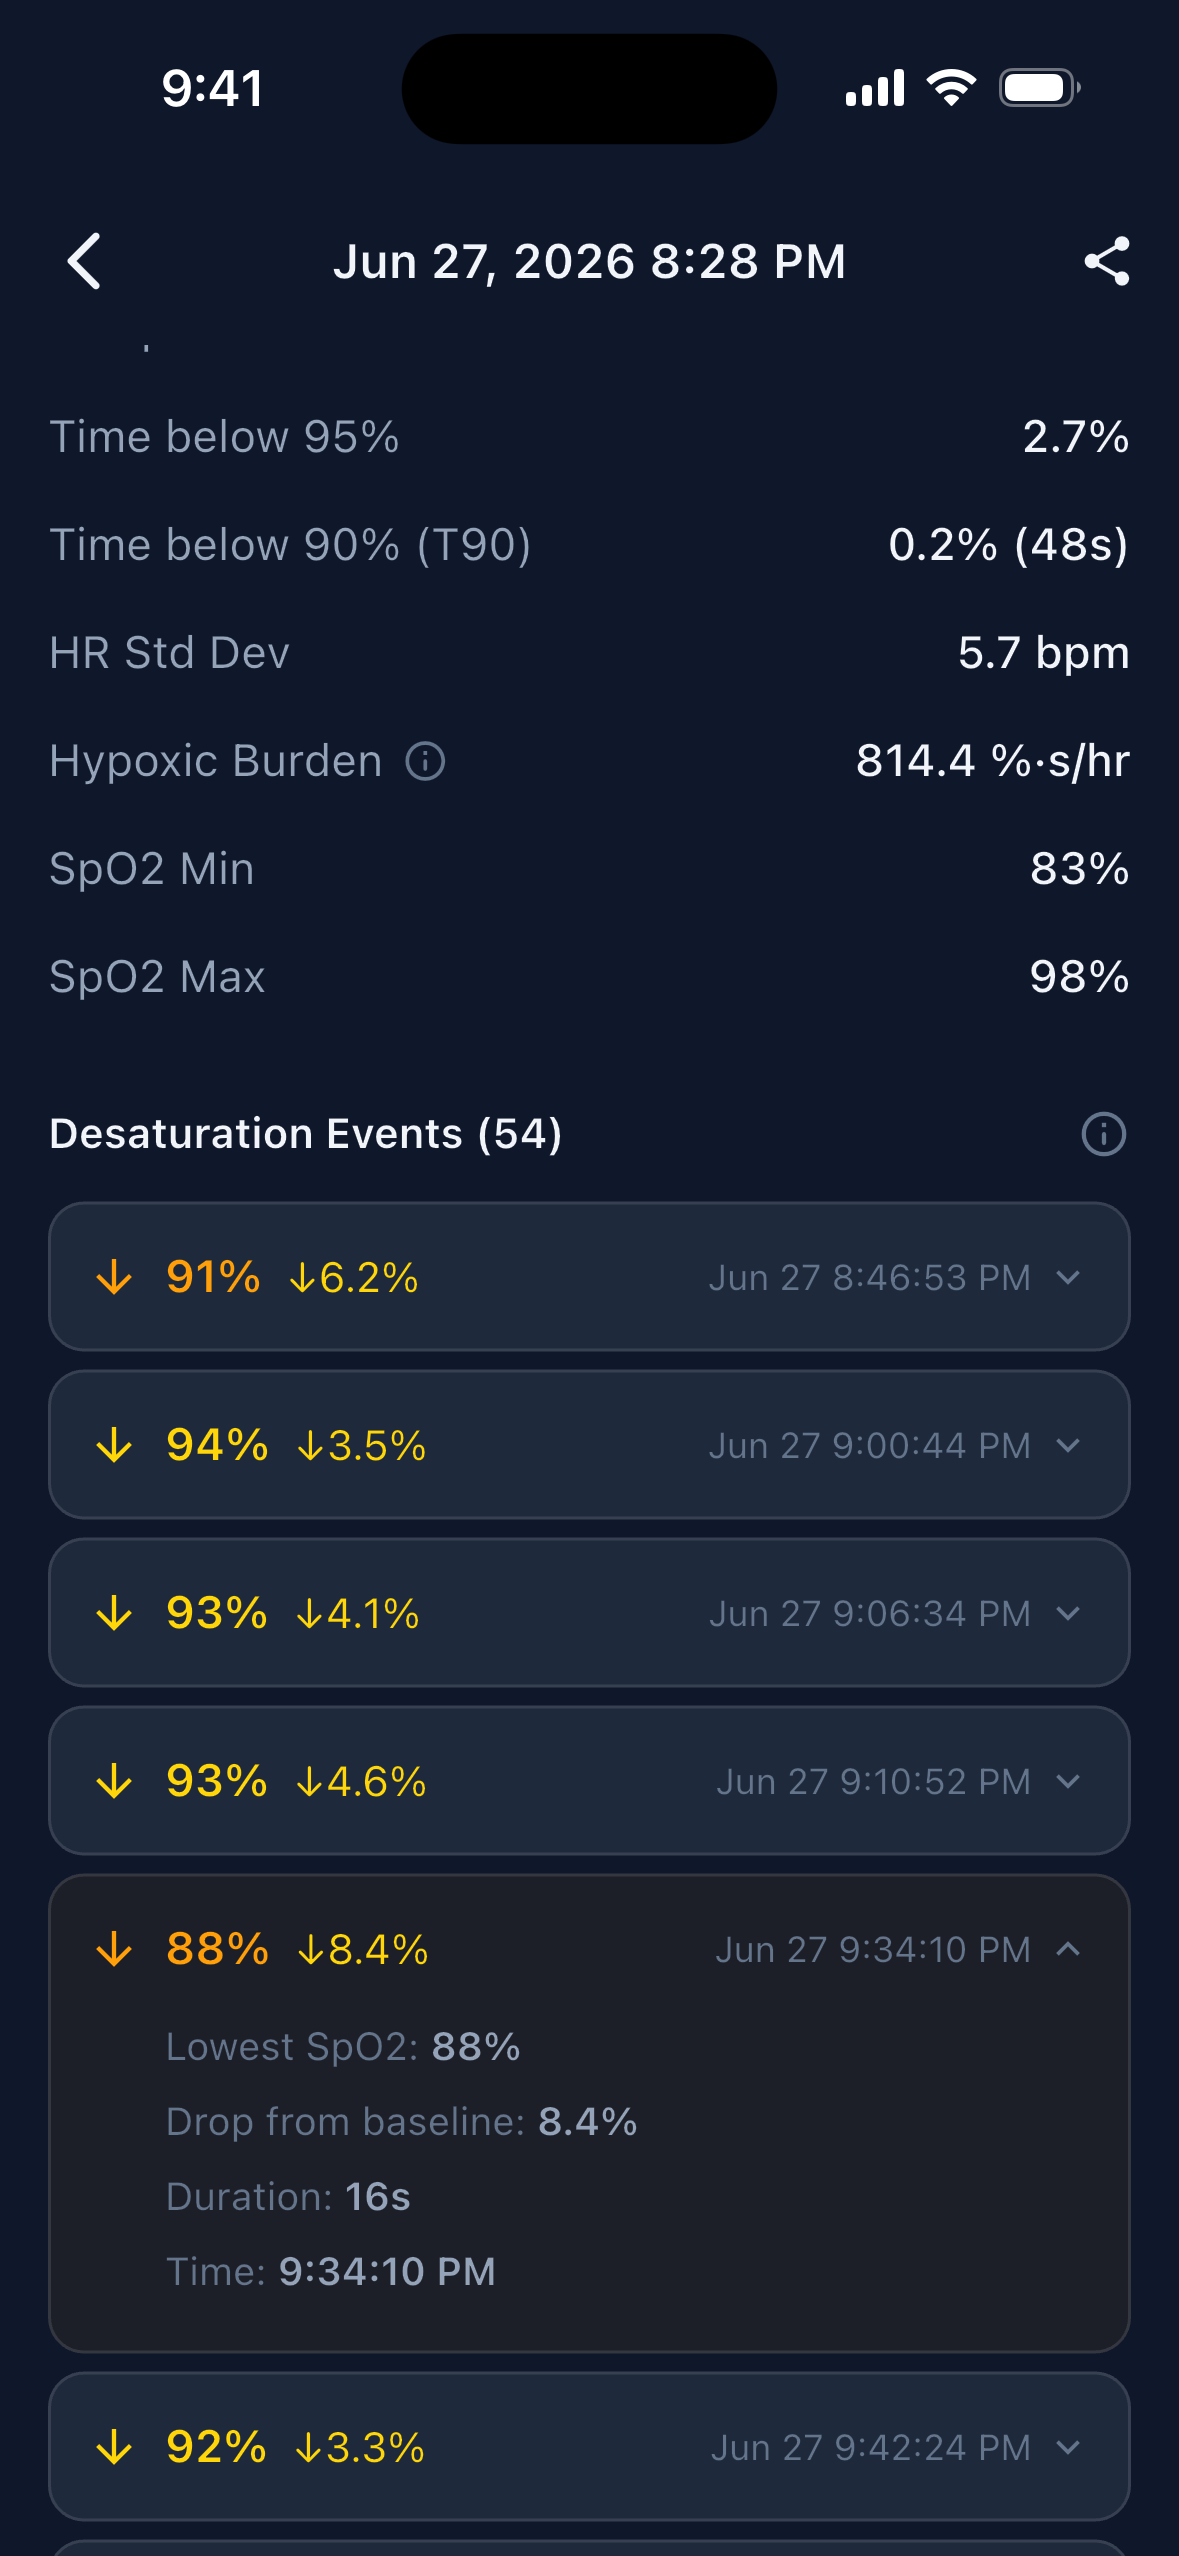
Replaying a night — lines break where data actually stopped.
5 · One page a doctor will actually read
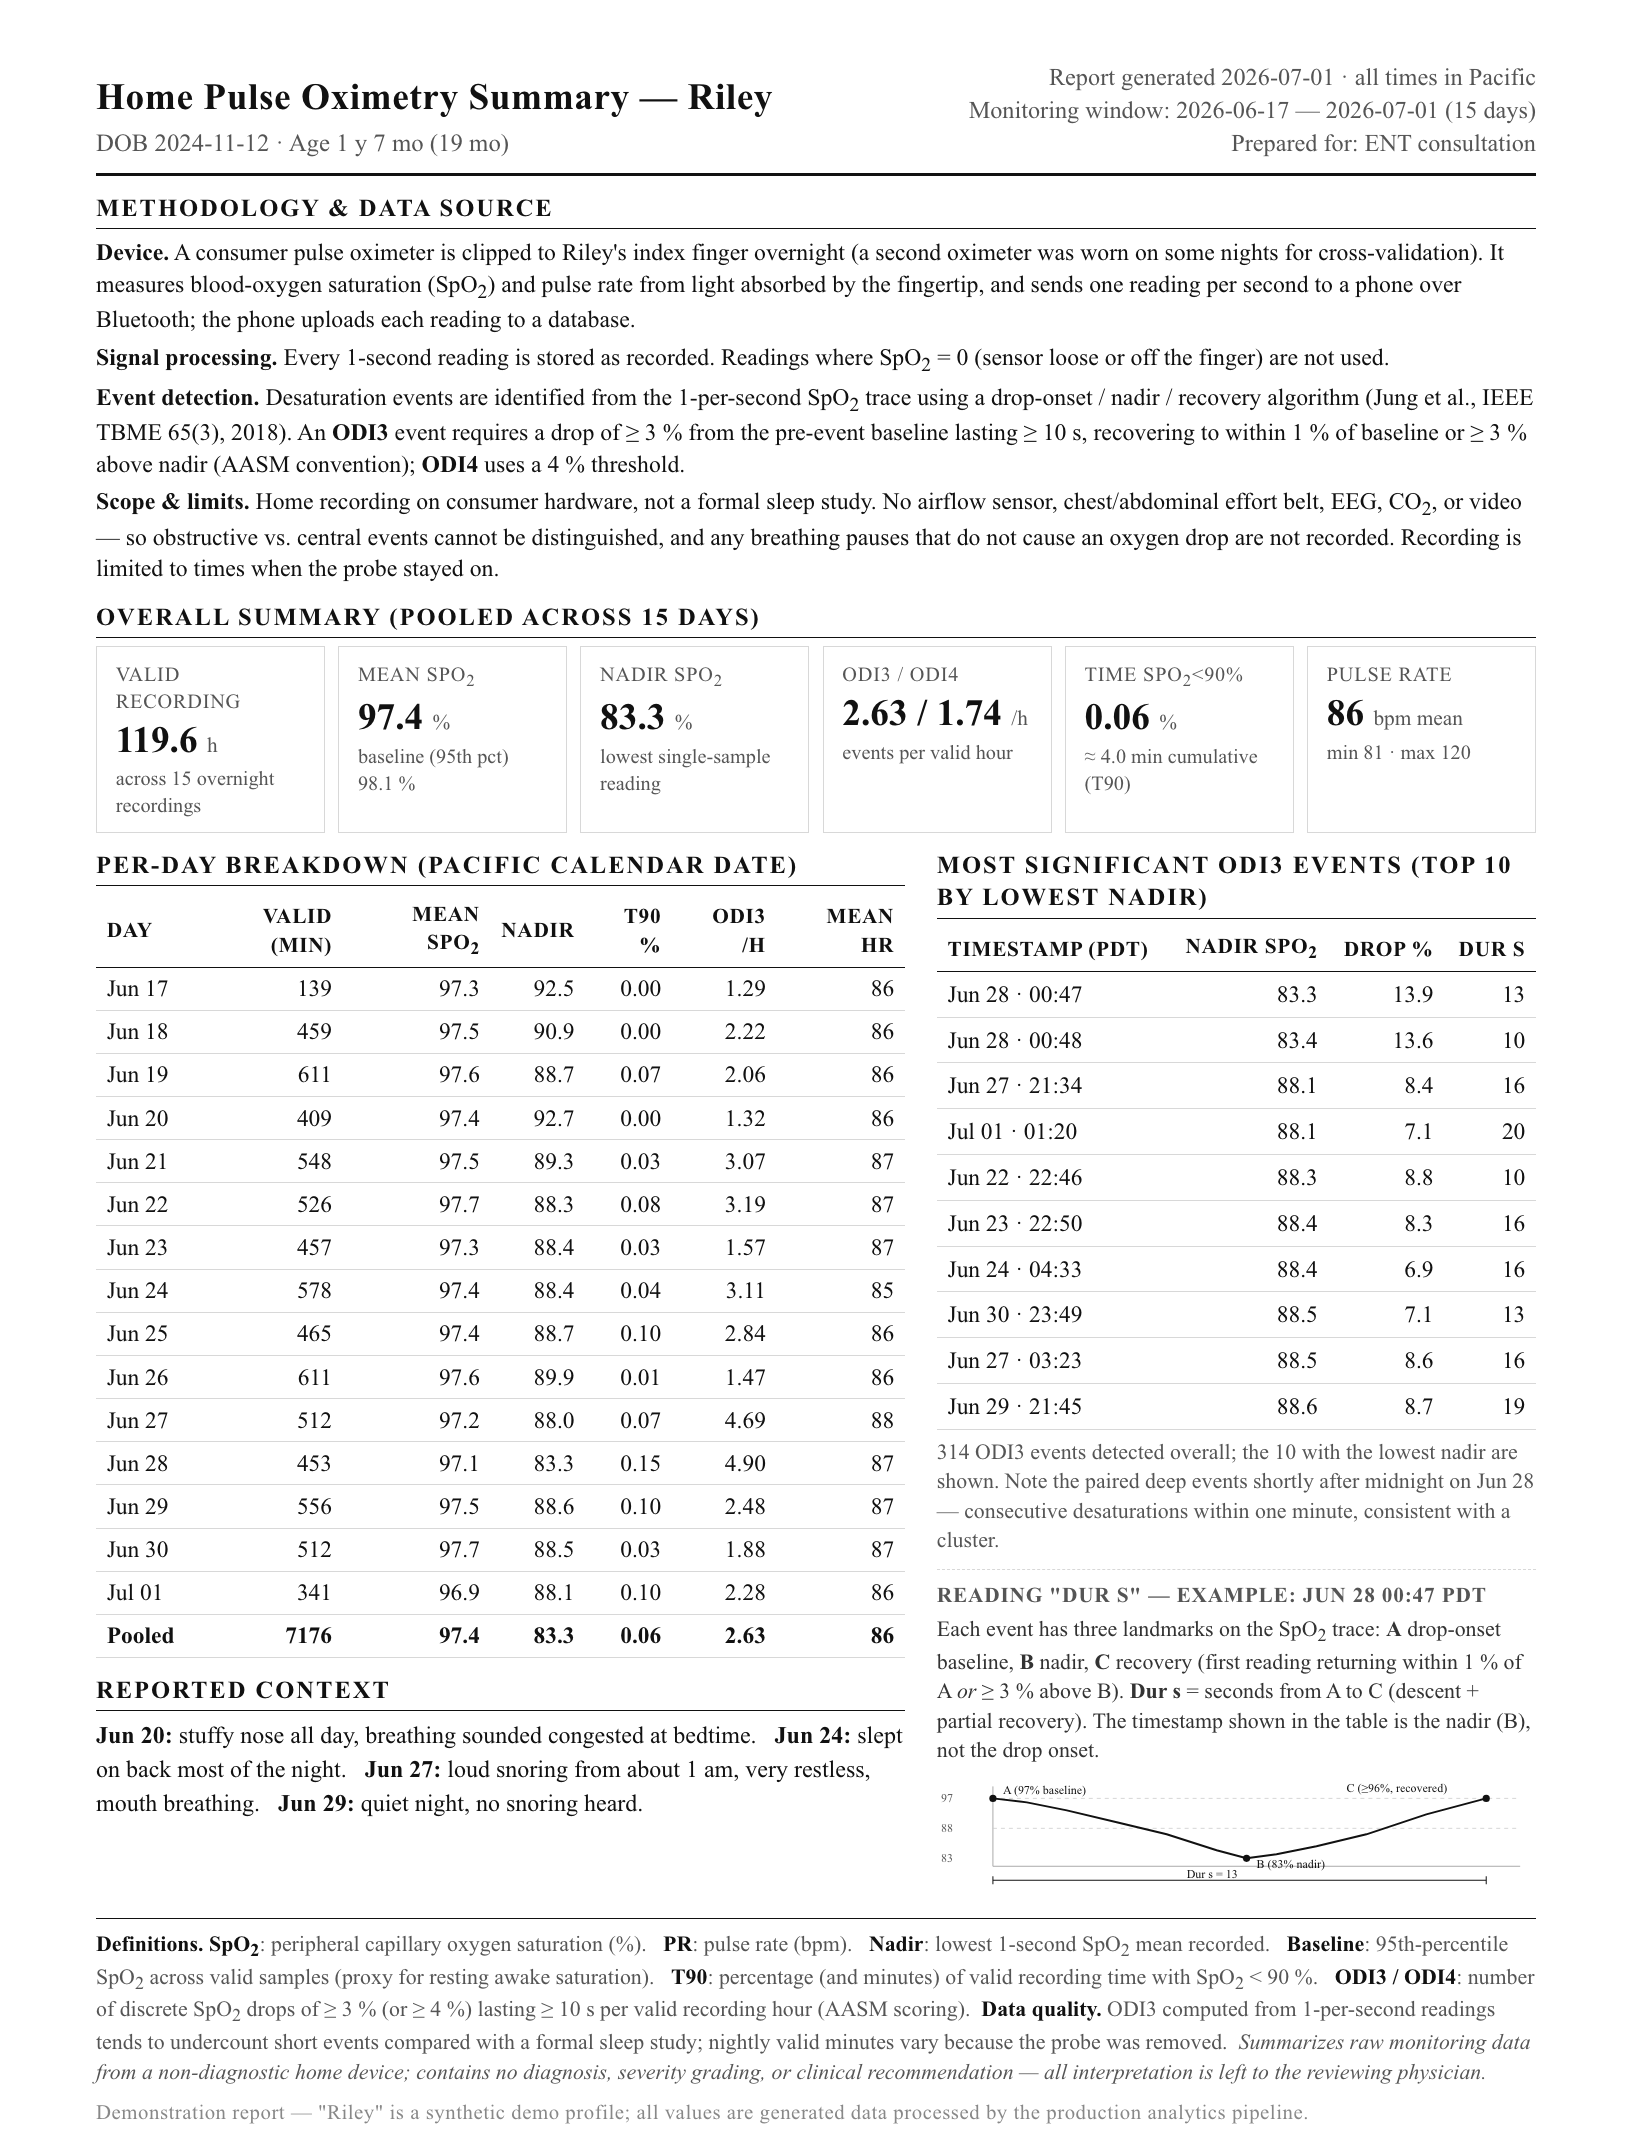
The end product of all of this is a single Letter page. It leads with methodology and
limits — which device, 1 Hz storage, Jung/AASM definitions, and an explicit
statement that a pulse oximeter records no airflow, no EEG, no CO₂, and cannot
distinguish obstructive from central apnea. Then the data: a six-KPI grid (valid hours,
mean SpO₂, nadir, ODI3/ODI4, time below 90%, heart rate), a per-day table across
weeks of nights, the parent-reported context, and the top desaturation events with the
onset–nadir–recovery explainer drawn right on the page. It ends with definitions and a
no-diagnosis disclaimer.
The one-pager, regenerated with a demo profile and synthetic data.
The payoff, told carefully: an ENT reviewed weeks of this data and concluded it was
sufficient to diagnose sleep apnea — no sleep study needed. The report
itself scrupulously avoids diagnosing; it just put weeks of real nights in front of
someone qualified to read them. And the honest footnote: the in-app share today is a
structured text summary copied to the clipboard. The full report was assembled by hand
from the app's data. That's stated here because it's true, and because the gap between
"the data was good enough" and "the export is fully automated" is exactly the kind of
gap this project doesn't paper over.
6 · The breath we couldn't hear
The core limitation of the whole approach, stated with the physiology: when breathing
stops, blood oxygen doesn't fall immediately. Between lung-to-fingertip circulation
time and the device's own averaging, SpO₂ lags apnea onset by roughly
16–31 seconds. A pulse oximeter tells you oxygen already fell — not that
breathing just stopped. I wanted to close that gap by hearing the breath itself.
Two serious attempts. The first was a spectral breath detector:
microphone in, 200–1500 Hz bandpass, a per-band adaptive noise floor, and a state
machine tracking breathing, silence, and pause, with a running since-last-breath timer.
The second was genuinely wild — sonar: inaudible 18–20 kHz chirps
emitted from the laptop speaker, listening for the reflection shifts of a moving chest.
Both produced working prototypes. Neither survived contact with a real bedroom: quiet
breathing is acoustically indistinguishable from silence, hypopnea sounds exactly like
normal breathing, and the false-positive/false-negative trade never closed. The
literature agrees — state-of-the-art acoustic models still struggle with precisely
this. Both prototypes live on an unmerged branch, and the limitation is stated in the
report instead of being papered over by a detector I couldn't trust.
Two dead ends, drawn as dead ends. This — plus no airflow, EEG, or CO₂ — is the honest gap between this system and a sleep lab.
Selected screens
All screens use a demo profile with synthetic data — no real person's data is shown anywhere on this page.